태그 보관물: grafana

Get alarms to Telegram in Grafana

1. 알람 채널 추가

  • Alerting > Notification channels 메뉴를 선택합니다.

    /images/2021-01-26-Common-Grafana-Alert/alert_01.png

  • New channel 을 클릭합니다. /images/2021-01-26-Common-Grafana-Alert/alert_02.png
  • Type 을 Telegram 으로 선택합니다.

    /images/2021-01-26-Common-Grafana-Alert/alert_03.png

    /images/2021-01-26-Common-Grafana-Alert/alert_04.png

    • Name, Default : 모든 알람 받기
    • Include image : 이미지 포함 여부
    • Disable Resolve Message : 해결 알람 받지 않기
    • Send reminders : 알림 상기시키기
    • Telegram API settings (BOT API Token, Chat ID) : 텔레그램에 봇을 추가하여 해당 토큰과 사용자의 챗 ID를 기입

    설정하고 Save 버튼을 눌러서 저장합니다.

  • 추가된 Channel 입니다. /images/2021-01-26-Common-Grafana-Alert/alert_05.png

2. 대시보드 패널에 알람 추가

  • 초당 요청량과 평균 응답속도 패널에 특정 수치로 알람을 설정 해보겠습니다. /images/2021-01-26-Common-Grafana-Alert/alert_06.png
  • 추가 하고싶은 패널의 수정 버튼을 누릅니다. 하단의 Alert 설정에서 Create Alert 버튼을 누릅니다. /images/2021-01-26-Common-Grafana-Alert/alert_07.png
  • 그래프 오른쪽 하트를 위 아래로 드래그하여 알람수치를 조정 할 수 있습니다. /images/2021-01-26-Common-Grafana-Alert/alert_08.png
  • 알람 이름과 규칙을 정합니다.

    Evaluate every 10s For 30s

    30초 동안 10초 마다 체크

  • Conditions은 여러개를 추가 할 수 있습니다.

    WHEN avg () OF query (A, 10s, now) IS ABOVE 400

    패널에 추가된 쿼리 A 수치가 10초 전부터 현재까지 평균 값이 400을 넘는 상태 /images/2021-01-26-Common-Grafana-Alert/alert_09.png

  • 평균 응답속도에 대해서도 알람을 설정하겠습니다.

    Evaluate every 10s For 0

    10초 마다 체크 하도록 설정했습니다.

    WHEN max () OF query (B, 10s, now) IS ABOVE 0.03

    OR max () OF query (C, 10s, now) IS ABOVE 0.03

    쿼리 B, C 중에서 10초 전부터 현재까지 최대값이 0.03초를 넘는 상태에 대해서 알람 설정을 했습니다. /images/2021-01-26-Common-Grafana-Alert/alert_10.png

    Conditions 에는 다양한 값으로 조건을 설정 할 수 있습니다. /images/2021-01-26-Common-Grafana-Alert/alert_10_1.png

3. 알람 확인 및 활용

  • 알림 리스트를 대시보드에 패널로 추가할 수 있습니다. /images/2021-01-26-Common-Grafana-Alert/alert_11.png
  • 대시보드에 알람 및 리스트가 추가된 모습입니다. /images/2021-01-26-Common-Grafana-Alert/alert_13.png
  • Telegram 알람 확인 앞서 Notification Channel 에서 Include image 를 설정하였기 때문에 이미지와 함께 알람이 오게 됩니다.

    초당 요청량은 ‘Evaluate every 10s For 30s’ 30초 동안 10초 마다 확인 하도록 설정 하였기 때문에 PENDING(보류중) 알람이 오지않고 보류 상태가 됩니다.

    평균 응답 속도에는 ‘Evaluate every 10s For 0’ 10초 마다 상태를 확인해서 보내도록 설정하여 보류하지 않고 바로 알람이 오게 됩니다.

    • 초록색 : OK
    • 주황색 : PENDING
    • 빨간색 : ALERTING

    /images/2021-01-26-Common-Grafana-Alert/alert_14.png

  • 알람 설정에서 State history 버튼을 눌러서 상태 히스토리를 확인 할 수 있습니다. /images/2021-01-26-Common-Grafana-Alert/alert_15.png
  • Alerting 메뉴에서 Alert Rules 을 선택하면 알람 설정 수정으로 바로가거나 시작 및 일시중지 제어 할 수 있습니다. /images/2021-01-26-Common-Grafana-Alert/alert_16.png


참고 자료

  • https://grafana.com/docs/grafana/latest/alerting/

Configuring Monitoring Dashboards Through Grafana

그라파나?

  • 그라파나는 데이터를 시각화하여 분석 및 모니터링을 용이하게 해주는 오픈소스 분석 플랫폼입니다. 여러 데이터 소스를 연동하여 사용 할 수 있으며 시각화 된 데이터들을 대시보드로 만들 수 있습니다.

    LIVE DEMO

  • 앞서 설치한 그라파나와 프로메테우스의 메트릭 정보를 조회하여 시각화 하는 방법에 대해 알아보겠습니다.

구성 방법

1. 데이터 소스 생성

  • Create a data source 메뉴를 선택합니다. /images/2020-03-17-Common-Dashborad/grafana_1.PNG
  • 데이터 소스로 프로메테우스를 선택합니다. /images/2020-03-17-Common-Dashborad/grafana_2.PNG
  • 프로메테우스 서버 정보를 입력한 후 하단의 Save&Test를 클릭합니다.
    • 연결테스트 후 이상이 없다면 저장됩니다.

/images/2020-03-17-Common-Dashborad/grafana_3.PNG

2. 대시 보드 생성

  • 홈으로 돌아와 Build a dashboard 메뉴를 선택합니다.

/images/2020-03-17-Common-Dashborad/grafana_4.PNG

  • 패널 선택장이 나옵니다. 대시보드는 이 패널들을 구성하고 배치하면 됩니다.
    • 메트릭 조회를 위해 Add Query를 선택합니다

/images/2020-03-17-Common-Dashborad/grafana_5PNG

  • Query 선택창에서 앞에 생성한 Data Source를 불러옵니다.
  • Metric에선 노드익스포터에서 수집한 항목을 선택합니다.

/images/2020-03-17-Common-Dashborad/grafana_7PNG

잠시 돌아와서 위에 선택한 메트릭 항목은 아래와 같은 구조를 가지고 있습니다.
따라서 Metric name으로만 조회시 프로메테우스 서버가 수집한 같은 이름 항목 전부를 조회 합니다. Label name으로 구분하여 조회 할 수 있습니다.
  • Prometheus Metric

/images/2020-03-17-Common-Dashborad/metrics.PNG

  • 이처럼 프로메테우스 서버에서도 메트릭을 조회할 수 있습니다.
  • node_cpu_seconds_total{job=”kube2”,mode=”system”}
    • ex) kube2 host에서 system 영역 cpu 사용률

/images/2020-03-17-Common-Dashborad/grafana_9.PNG

  • 다시 돌아와서 생성한 패널 쿼리에 적용해보겠습니다.

/images/2020-03-17-Common-Dashborad/grafana_10.PNG

  • node_cpu_seconds_total는 계속 누적이 되고 있는 값이기 때문에 rate함수를 사용합니다.
  • rate(node_cpu_seconds_total{job=”kube2”,mode=”system”}[10m])
    • 10분동안 CPU 사용율 변화수치를 초당으로 변환

/images/2020-03-17-Common-Dashborad/grafana_11.PNG

  • CPU 코어의 평균을 구하여 해당 서버의 CPU 평균 사용률을 표시합니다. -avg(rate(node_cpu_seconds_total{job=”kube2”,mode=”system”}[10m])) by (job)

/images/2020-03-17-Common-Dashborad/grafana_12.PNG

  • 설정에서 그래프 종류를 선택할 수 있습니다.

/images/2020-03-17-Common-Dashborad/grafana_6.PNG

이처럼 자신의 필요한 메트릭 정보를 집계하여 패널로 만든 후 대시보드를 구성하면 됩니다.

외부 대시보드 포맷 사용

  • 매트릭 정보를 직접 집계하여 사용하거나 필요한 데이터를 정의하는게 나름 번거로운 작업이라 그라파나 홈페이지에 다른 여러 사용자들이 구성해놓은 대시보드 포맷을 사용하면 더 쉽게 대시보드를구현할 수 있습니다.

https://grafana.com/grafana/dashboards

/images/2020-03-17-Common-Dashborad/grafana_13.PNG

  • import 화면에서 다운받은 JSON 파일을 upload하거나 COPY ID를 입력하여 적용합니다.

/images/2020-03-17-Common-Dashborad/grafana_14.PNG

결론

프로메테우스, 그라파나를 통해 비교적 쉽게 모니터링을 위한 프로세스들을 만들 수 있었습니다. 여러 익스포터를 통해 필요한 매트릭 수집을 확장할 수 있다는게 큰 장점인 것 같으며 PULL 방식이라 부하에 따른 장애나 성능감소를 걱정하지 않아도 된다고 합니다. 그라나파를 통해 매트릭 데이터를 보기 쉽게 만들 수 있었으며 다양한 데이터 소스를 지원하는 만큼 여러 분야에서 활용하면 좋을 것 같습니다.

Installing Prometheus and Grafana Using Docker-Compose

프로메테우스?

  • 프로메테우스는 오픈소스기반의 모니터링 솔루션이며 모니터링 대상이 되는 metric 정보를 pull 방식으로 수집합니다. 공식적으로 제공하는 exporter뿐만 아니라 여러 Third-pary exporter를 통하여 다양한 플랫폼을 모니터링 할 수 있는 장점이 있습니다.

/images/2020-03-16-Common-Prometheus/architecture.PNG

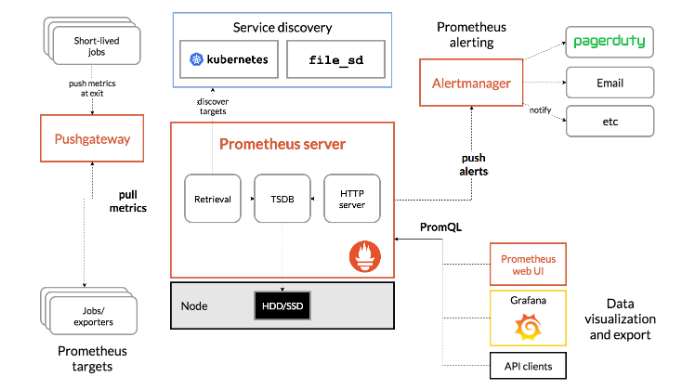
  • 여기서는 도커 컴포즈를 통하여 프로메테우스와 그라파나를 설치하고 Node-Exporter를 통해 받아온 Metric 정보로 그라파나 대시보드를 구성해보겠습니다.

설치 및 구성

1. 구성 환경

CENTOS 7.8

DOCKER 19.03.5, build 633a0ea

DOCKER-COMPOSE 1.25.3, build d4d1b42b

2. docker-compose.yml 작성

  • 공식적으로 설정된 포트들이 이미 사용중임에 따라 다른 포트로 대체하였습니다.
version: '3.7'
services:

  # 직접 설치로 대체
  #node:
  #  image: prom/node-exporter
  #  container_name: node-exporter
  #  ports:
  #    - 9101:9100
  #  networks:
  #    - prometheus-network

  prometheus:
    image: prom/prometheus:v2.16.0
    container_name: prometheus
    network_mode: "host" 
    command:
      - '--web.listen-address=0.0.0.0:9099'
      - '--config.file=/etc/prometheus/prometheus.yml'
      - '--storage.tsdb.path=/prometheus'
      - '--web.console.libraries=/etc/prometheus/console_libraries'
      - '--web.console.templates=/etc/prometheus/consoles'
      - '--storage.tsdb.retention.time=200h'
      - '--web.enable-lifecycle'
    volumes:
      - /data/prometheus:/etc/prometheus
      - /data/prometheus/data:/prometheus
    ports:
      - 9099:9099
    networks:
	  - prometheus-network

  grafana:
    container_name: grafana
    image: grafana/grafana:6.6.2
    environment:
      - GF_SECURITY_ADMIN_USER=user1
      - GF_SECURITY_ADMIN_PASSWORD=user1
      - GF_USERS_ALLOW_SIGN_UP=false
    volumes:
      - /data/grafana/data:/var/lib/grafana
      - /data/grafana/provisioning:/etc/grafana/provisioning
    ports:
      - 9900:3000
    depends_on:
      - prometheus
    networks:
      - prometheus-network

networks:
  prometheus-network:

부가 설명

  • 도커에서 노드 익스포터를 실행하는 것은 권장하지 않는다고 합니다. 이유는 도커는 머신의 내부동작과 컨테이너를 격리시키려고 하기 때문에 노드 익스포터에서 내부 동작 결과가 잘동작하지 않을 수 있기 때문입니다.
- #node:
  #  image: prom/node-exporter
  #  container_name: node-exporter
  #  ports:
  #    - 9101:9100
  #  networks:
  #    - prometheus-network
  • 컨테이너에서 호스트에 떠있는 프로세스로 접근이 안되어 NETWORK MODE를 HOST로 설정하였습니다.
network_mode: "host" 
  • 기존 구성 환경에서는 이미 기본포트가 쓰이고 있기 때문에 별도 설정을 통해 포트를 변경하였으며 config 파일 경로를 지정하였습니다.
command:
      - '--web.listen-address=0.0.0.0:9099'
      - '--config.file=/etc/prometheus/prometheus.yml'
  • 컨테이너 종료시에 데이터가 삭제될 수 있으므로 HOST의 볼륨 경로를 지정하였습니다.
volumes:
      - /data/prometheus:/etc/prometheus
      - /data/prometheus/data:/prometheus

3. prometheus.config 작성

  • 환경설정 파일을 작성합니다
  • 매트릭 수집 주기 설정
# my global config
global:
  scrape_interval:     15s # 15초 주기로 매트릭 수집
  • 익스포터 설정
  • 추가 될 때 마다 해당 형식으로 설정 파일내에 추가합니다.
# Exporter 설정
  - job_name: 'kube1'    # 사용할 이름
    scrape_interval: 10s # 주기
    static_configs:      # 익스포트 프로세스 설정
    - targets: ['prom1.danawa.com:9110','prom1.danawa.com:9111']

prometheus.config

# my global config
global:
  scrape_interval:     15s # Set the scrape interval to every 15 seconds. Default is every 1 minute.
  evaluation_interval: 15s # Evaluate rules every 15 seconds. The default is every 1 minute.
  # scrape_timeout is set to the global default (10s).

# Alertmanager configuration
alerting:
  alertmanagers:
  - static_configs:
    - targets:
      # - alertmanager:9093

# Load rules once and periodically evaluate them according to the global 'evaluation_interval'.
rule_files:
  # - "first_rules.yml"
  # - "second_rules.yml"


# A scrape configuration containing exactly one endpoint to scrape:
# Here it's Prometheus itself.
scrape_configs:
  - job_name: 'prometheus'

    static_configs:
    - targets: ['127.0.0.1:9099']

  # Exporter 설정
  - job_name: 'prom1'
    scrape_interval: 10s
    static_configs:
    - targets: ['prom1.danawa.com:9110','prom1.danawa.com:9111']

  - job_name: 'prom2'

    static_configs:
    - targets: ['prom2.danawa.com:9110']

  - job_name: 'prom3'

    static_configs:
    - targets: ['prom3.danawa.com:9110']

4. docker-compose 실행

docker-compose up -d

결과
Creating network "prometheus_prometheus-network" with the default driver
Creating node-exporter ... done
Creating prometheus    ... done
Creating grafana       ... done

5. node-exporter 설치

## 사용버전 0.18.1
## node-exporter의 기본 포트는 9100이지만 구성 환경에서 이미 사용중인 포트이므로 임의의 포트로 설정하여 기동하였습니다.

1. wget https://github.com/prometheus/node_exporter/releases/download/v0.18.1/node_exporter-0.18.1.linux-amd64.tar.gz

2. tar xvfz node_exporter-0.18.1.linux-amd64.tar.gz

3. mv node_exporter-0.18.1.linux-amd64/node_exporter /usr/local/bin/

4. /usr/local/bin/node_exporter --web.listen-address=:9110
  • 확인 : http://prom1.danawa.com:9110/metrics – 기본포트 9100
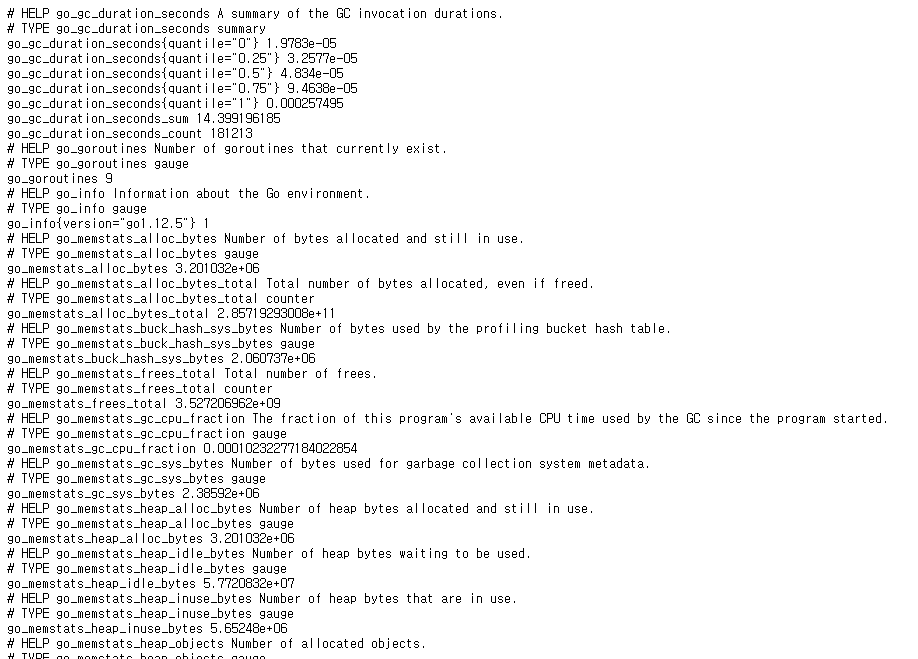
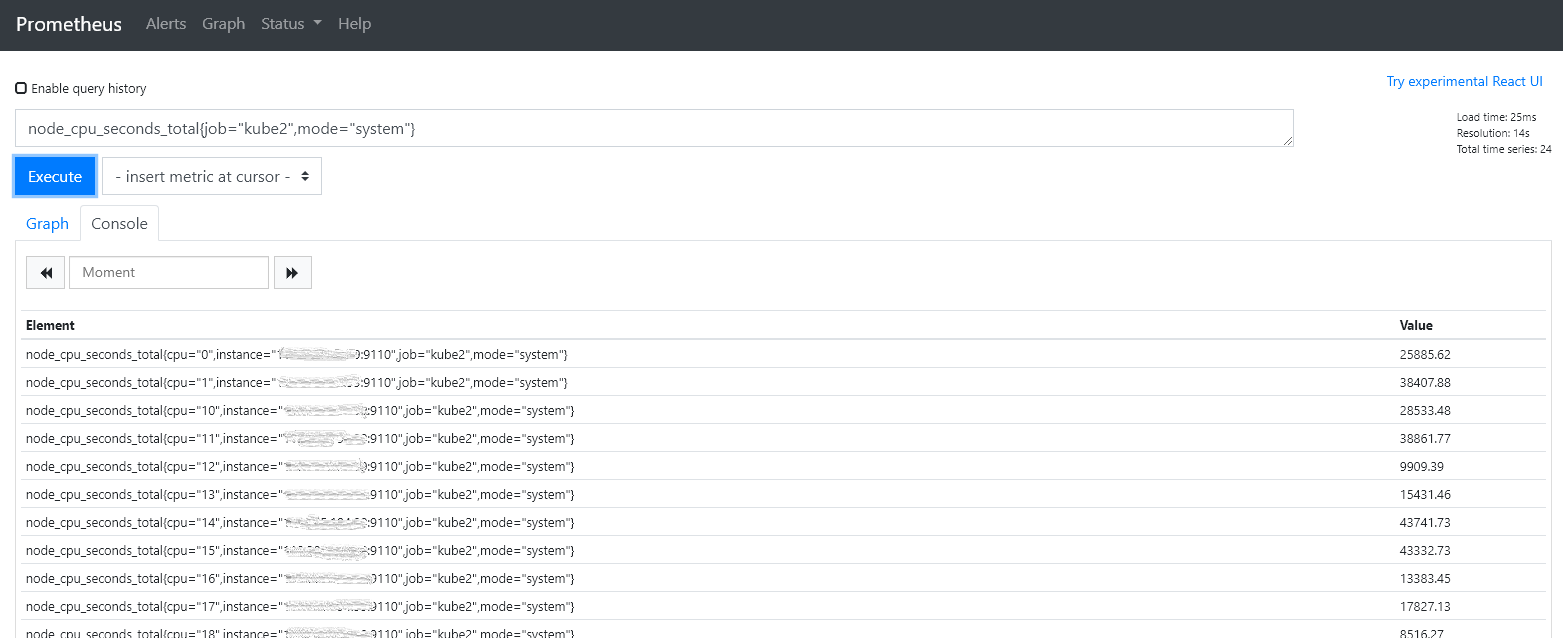
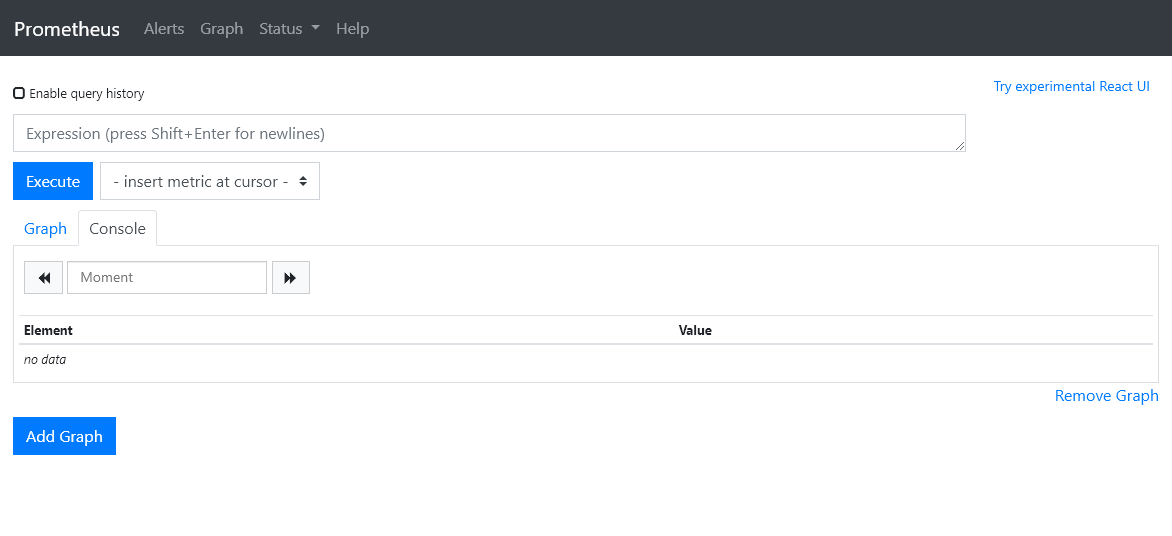
/images/2020-03-16-Common-Prometheus/node_exporter.PNG

6. prometheus 확인

http://prom1.danawa.com:9099 – 기본포트 9090

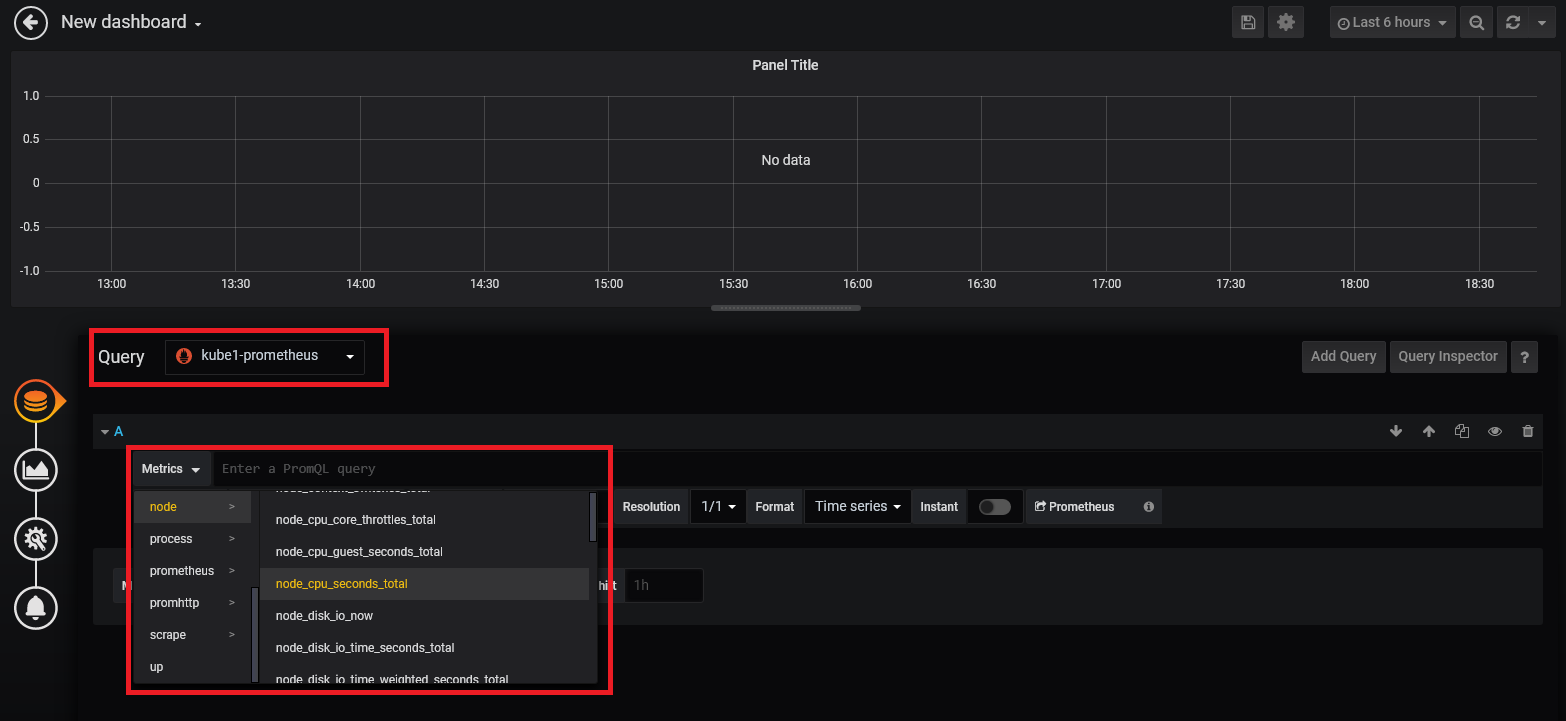
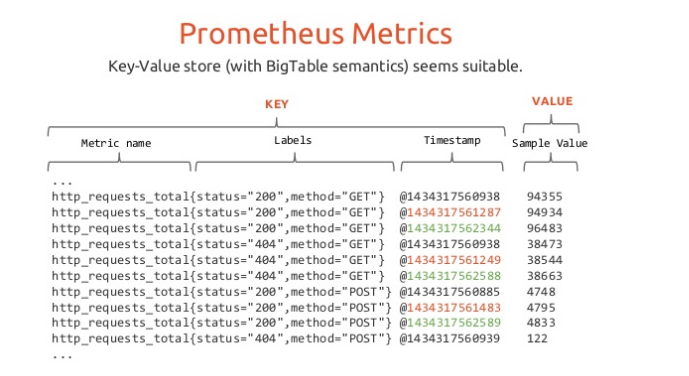
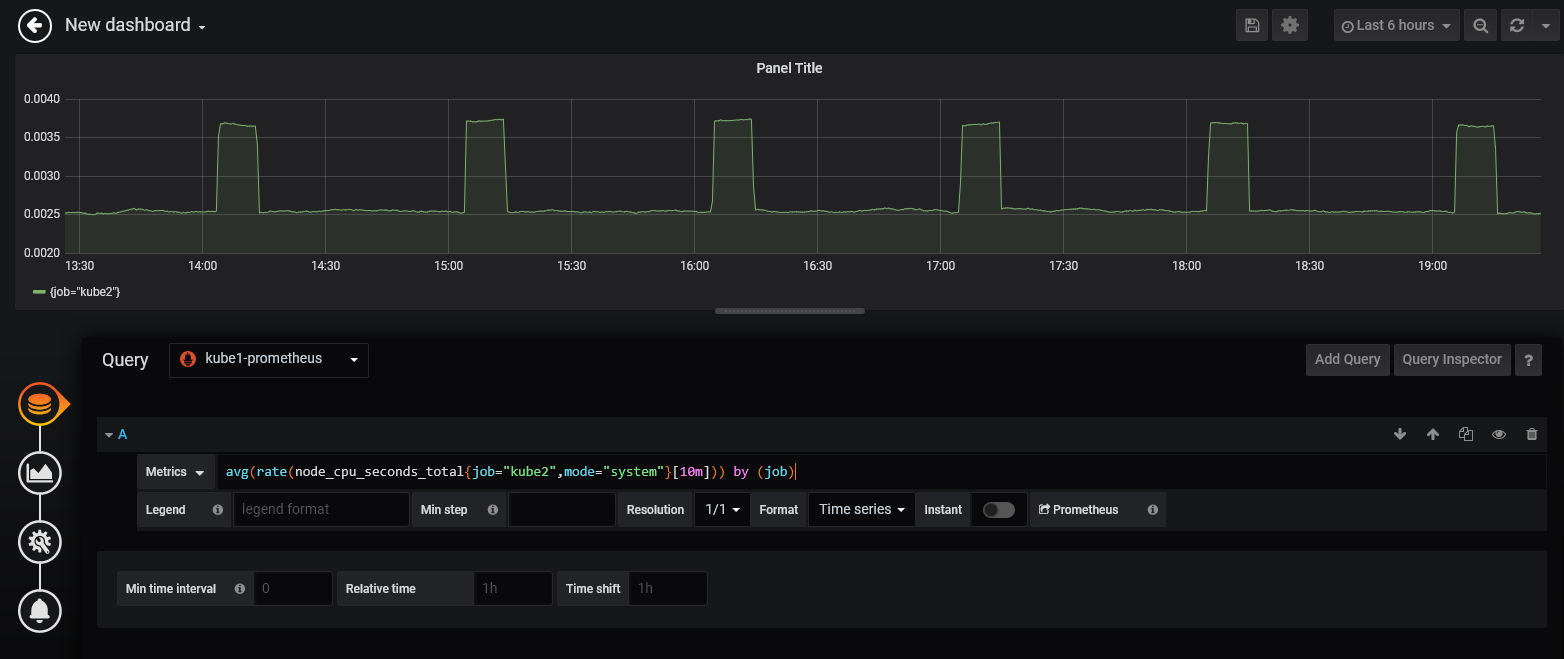
  • 익스포터로 수집된 메트릭정보를 조회해 볼 수 있습니다.
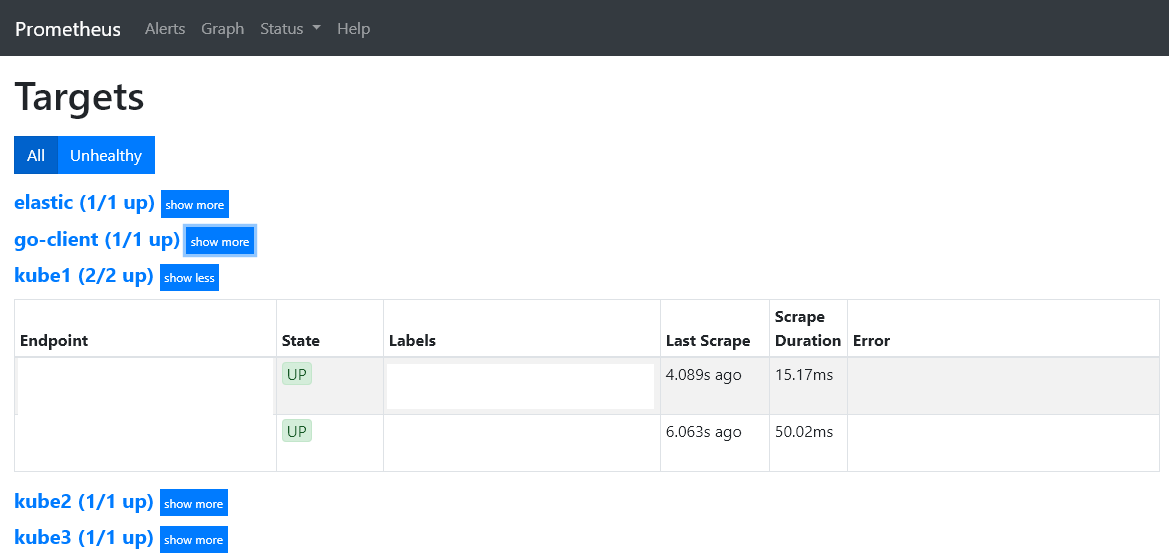
  • PROMQL을 사용해 데이터를 집계 할 수 있습니다.

/images/2020-03-16-Common-Prometheus/prometheus1.PNG

http://prom1.danawa.com:9099/targets
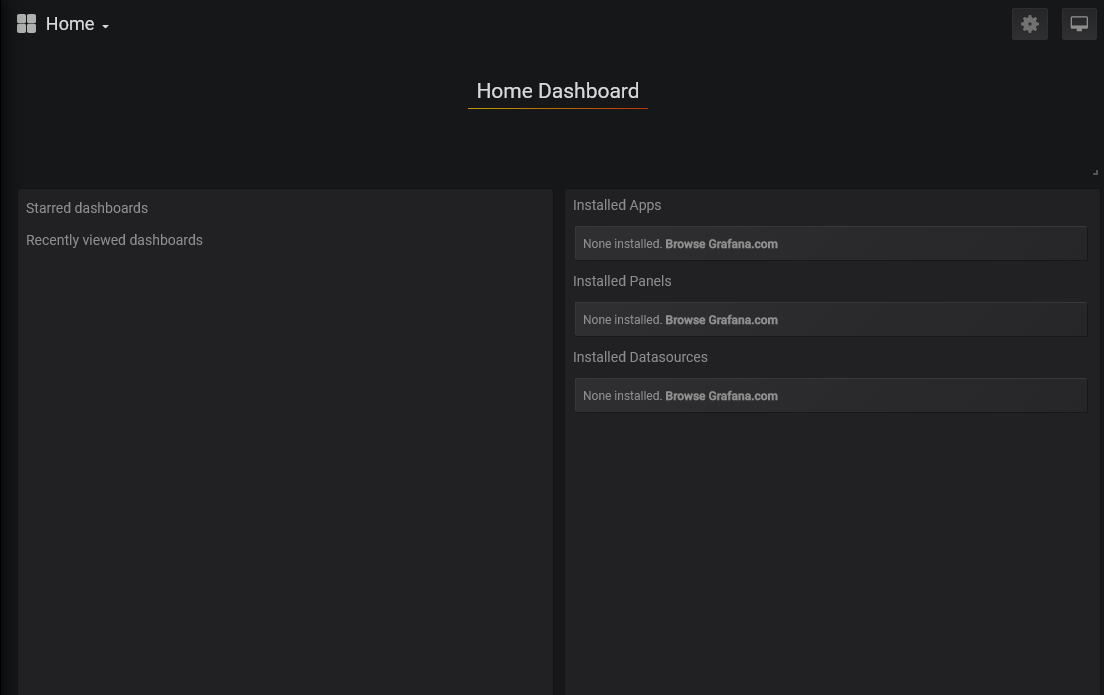
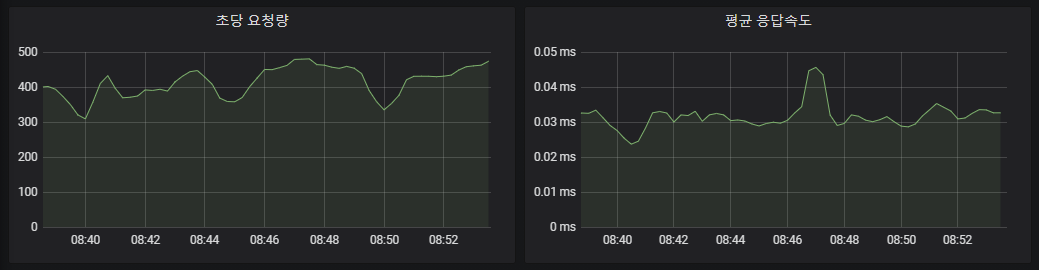
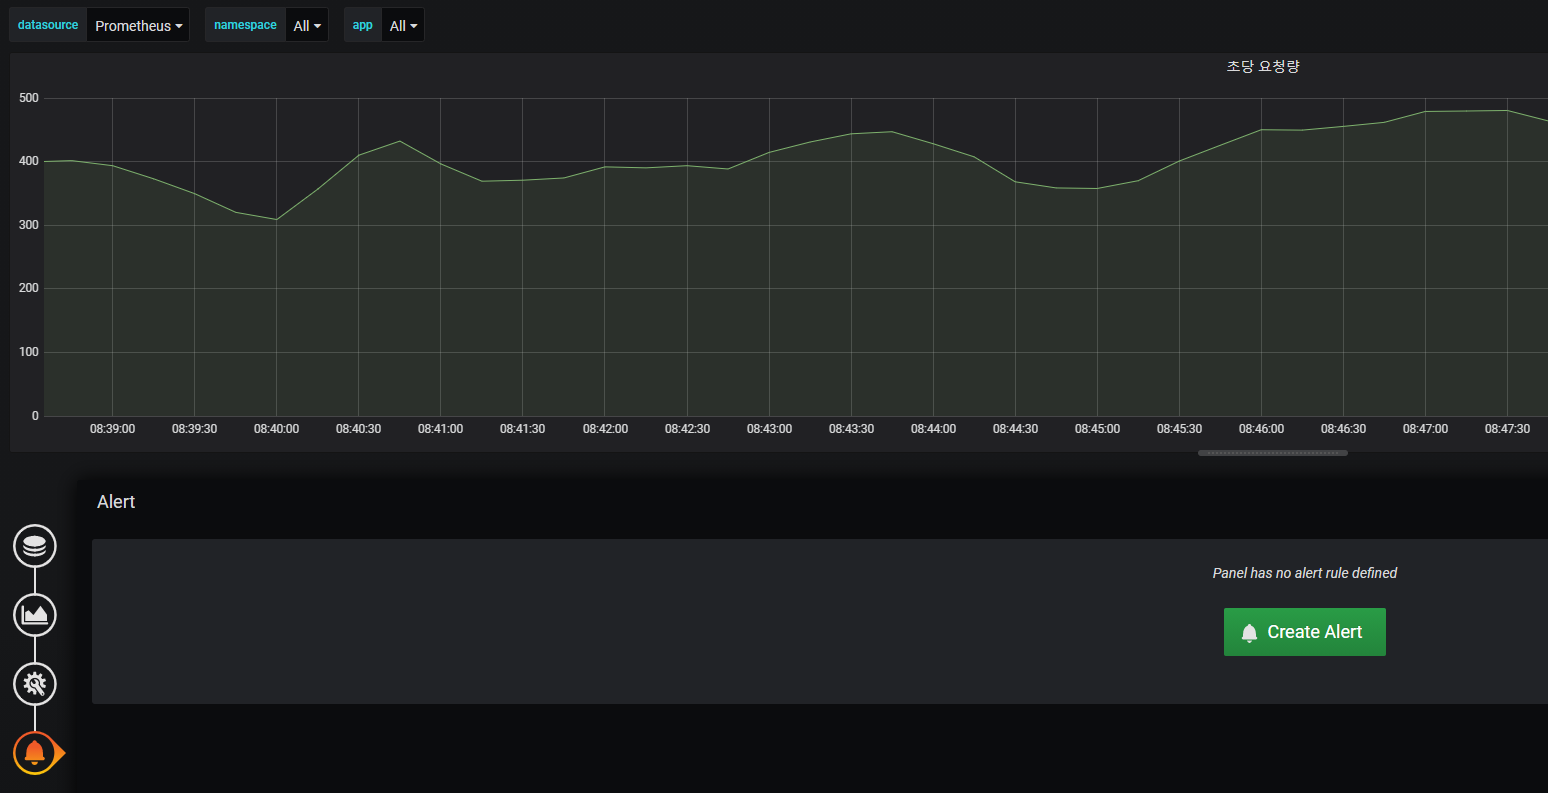
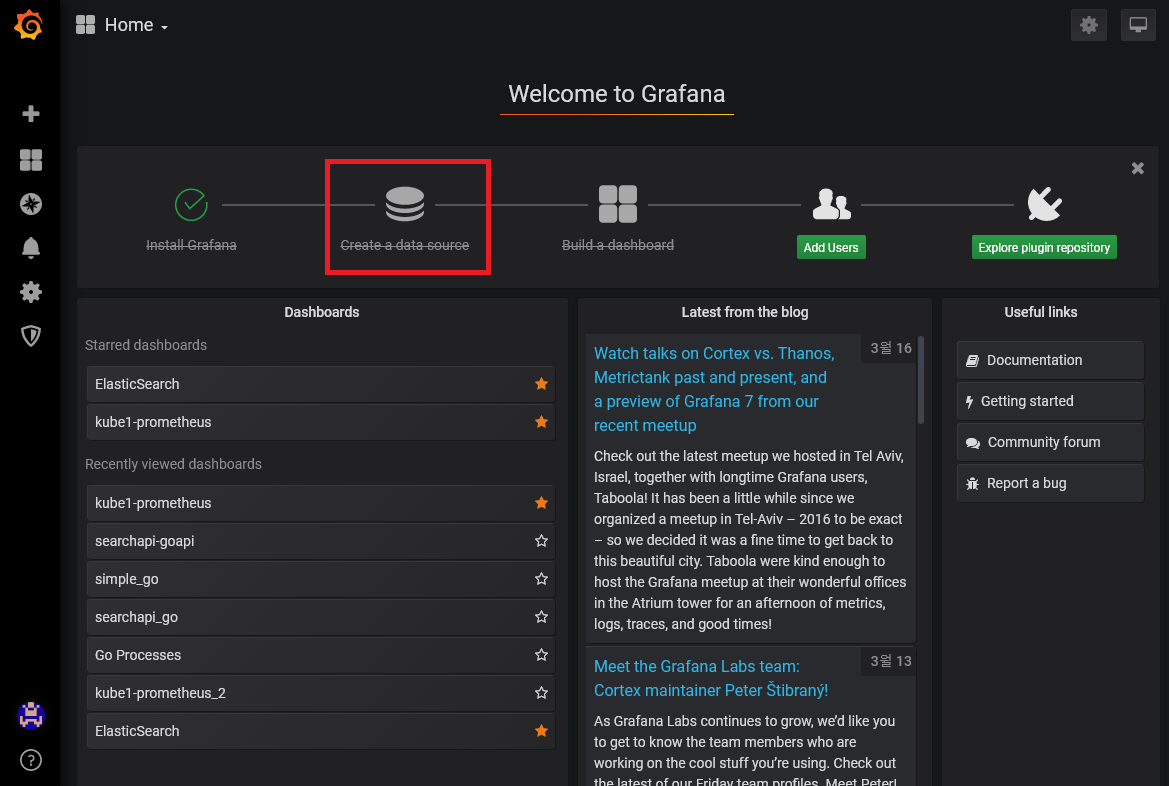
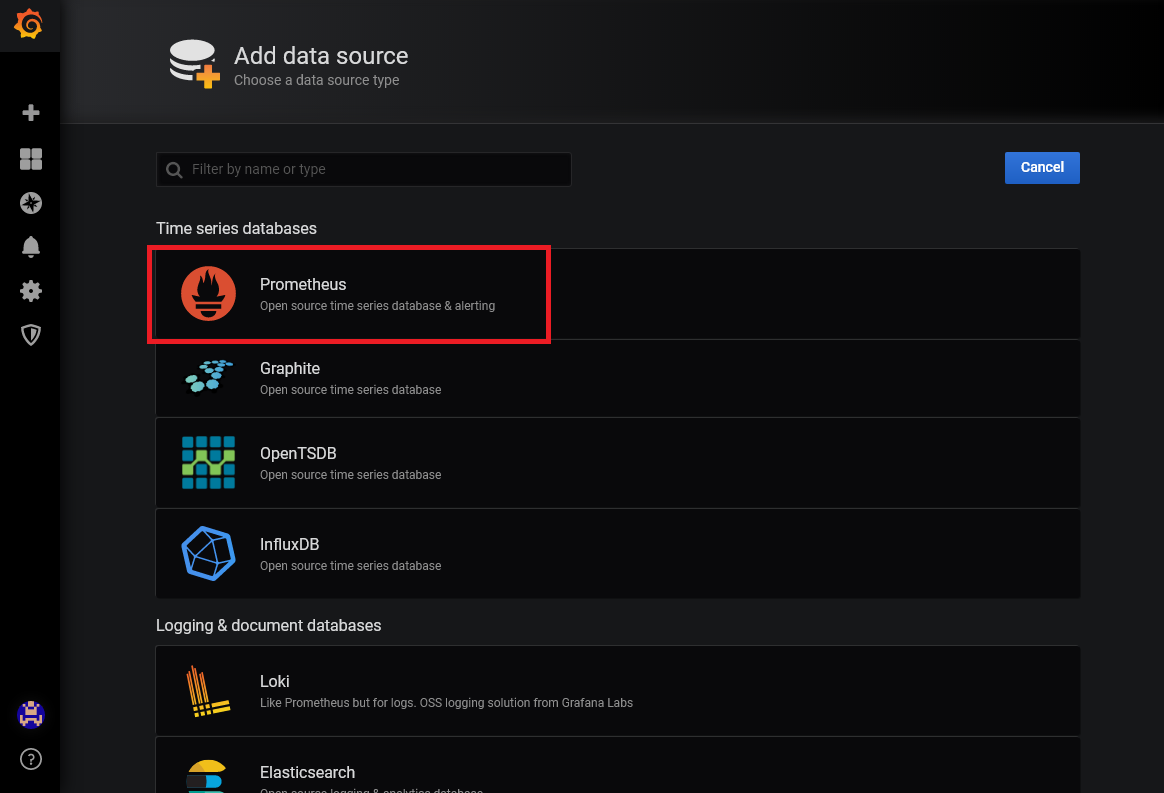
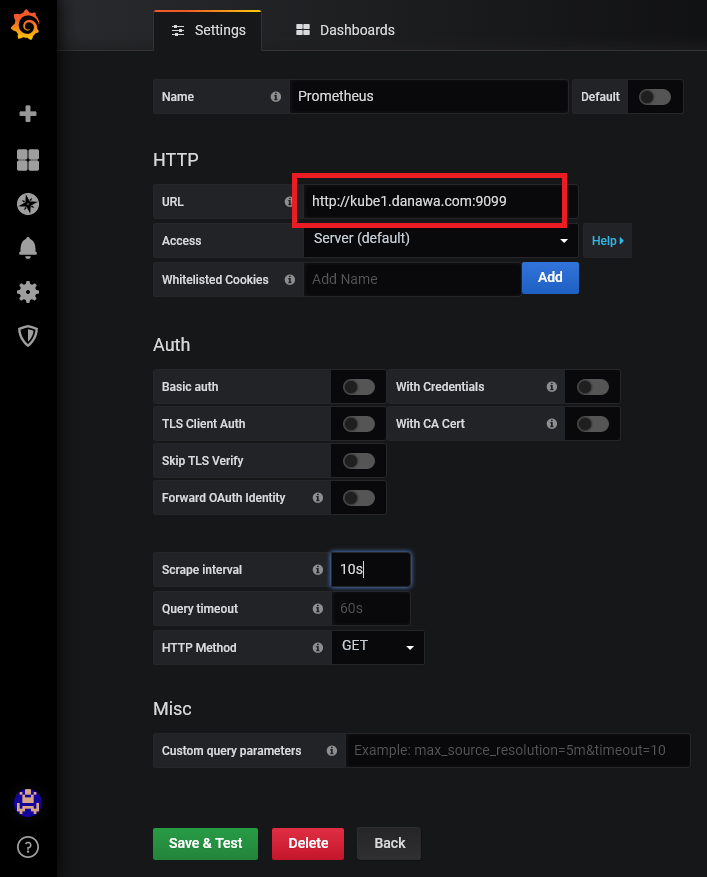
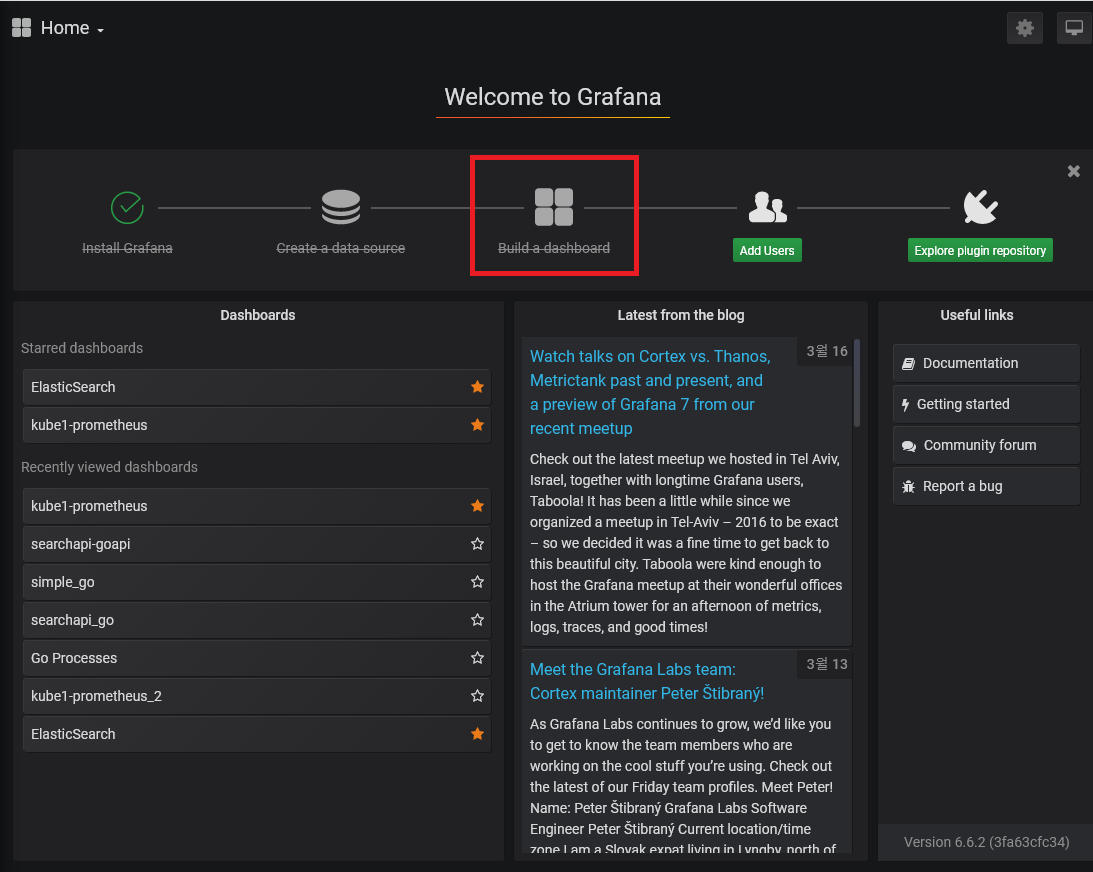
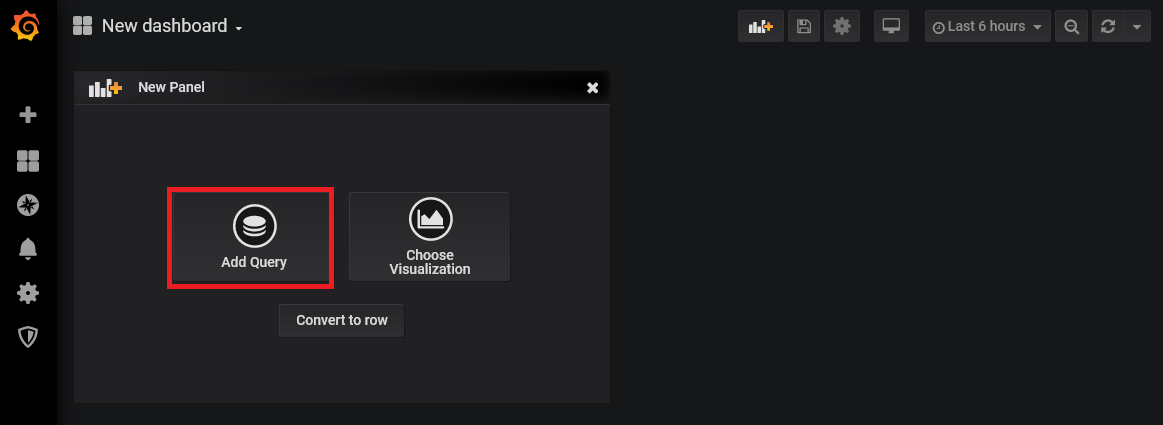
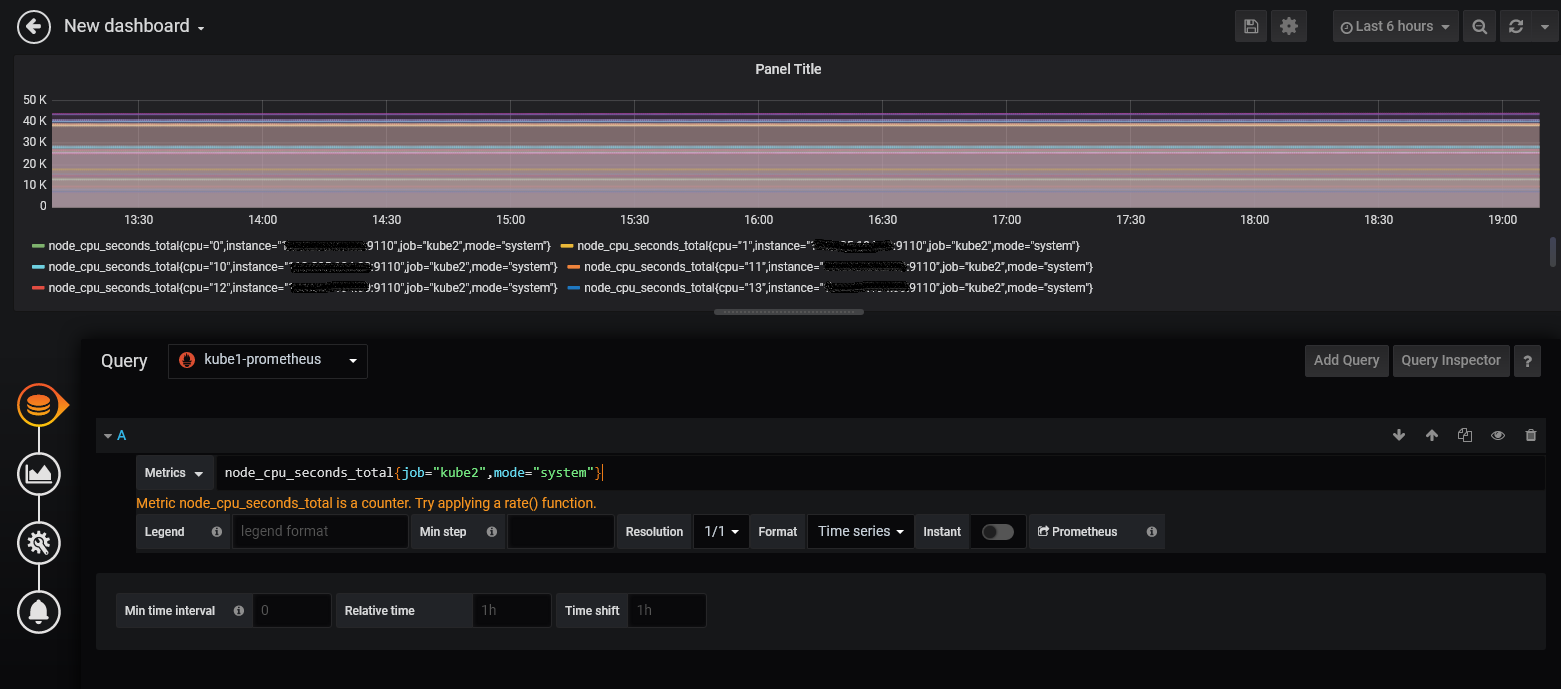
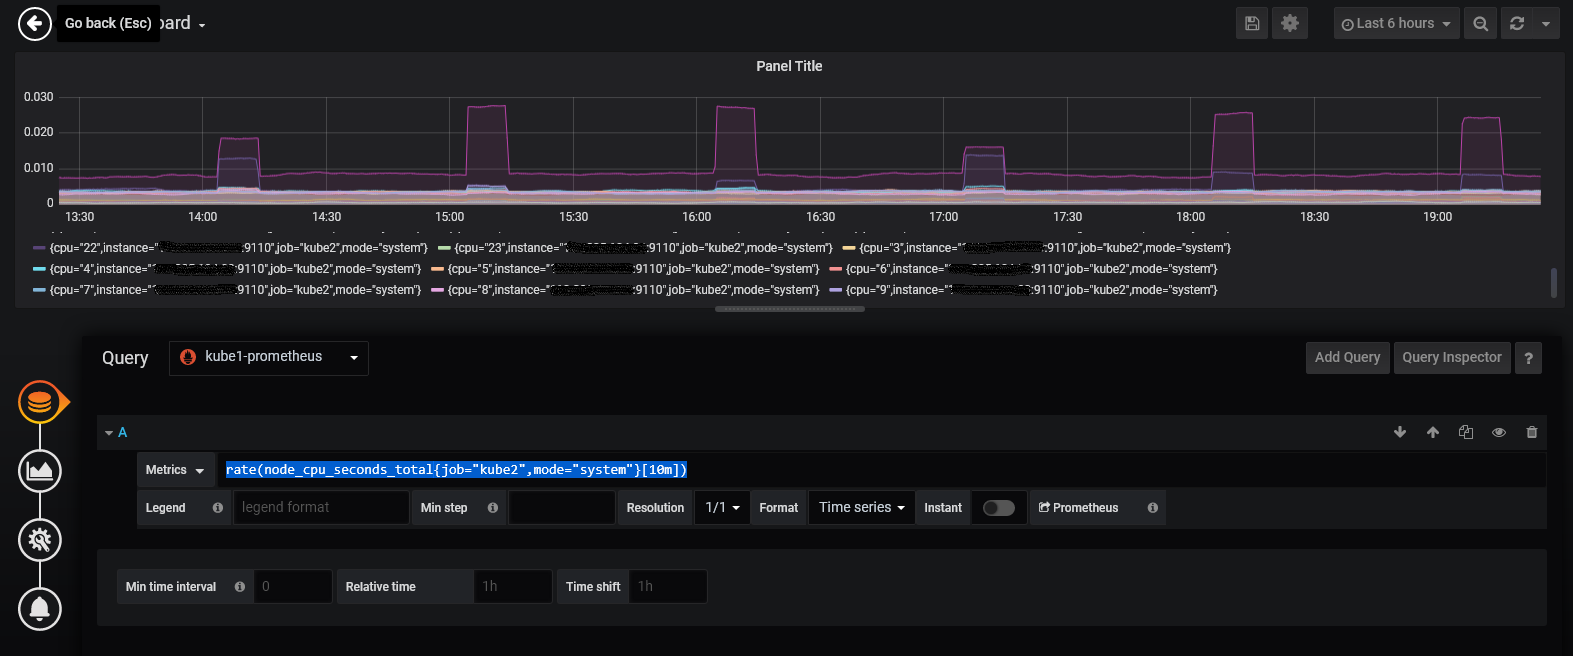
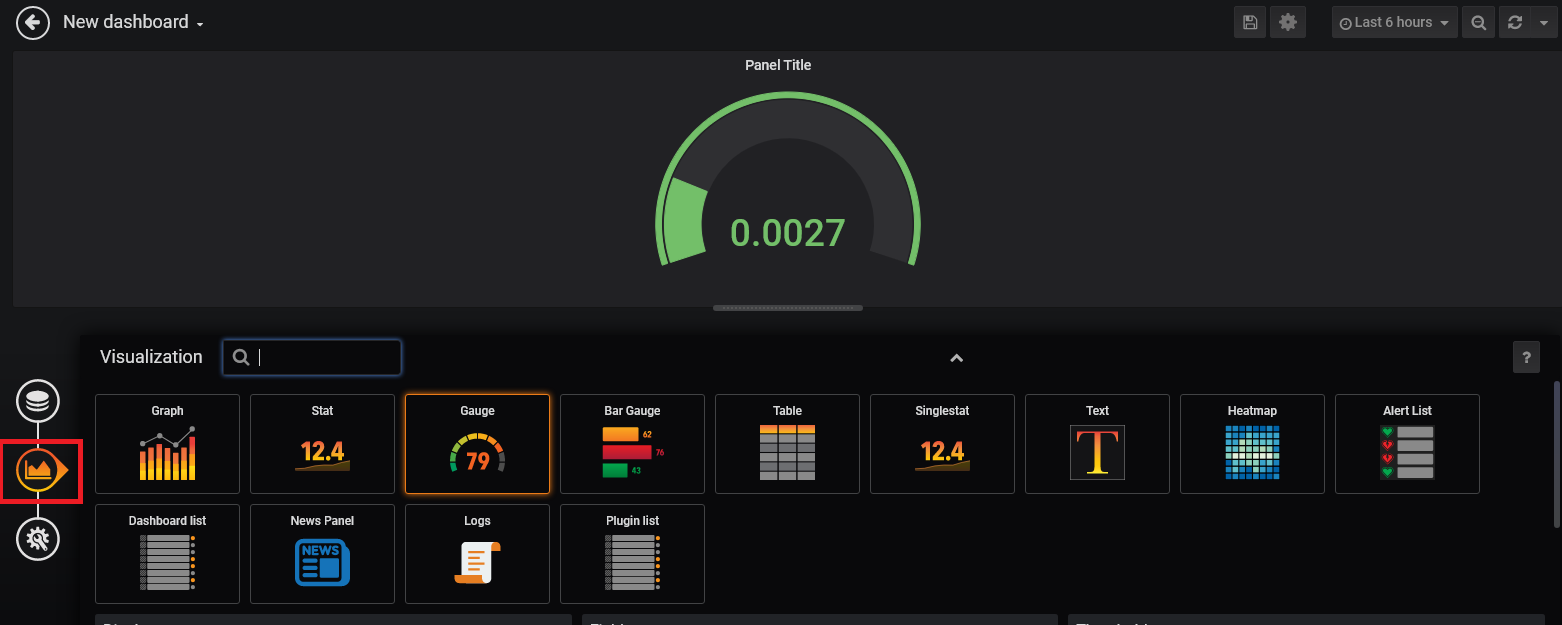
  • 익스포터의 상태를 확인 할 수 있습니다.

/images/2020-03-16-Common-Prometheus/prometheus1_2.PNG

6. grafana 확인

http://prom1.danawa.com:9900 – 기본포트 3000 /images/2020-03-16-Common-Prometheus/grafana.PNG

/images/2020-03-16-Common-Prometheus/grafana2.PNG